on Sentinel")
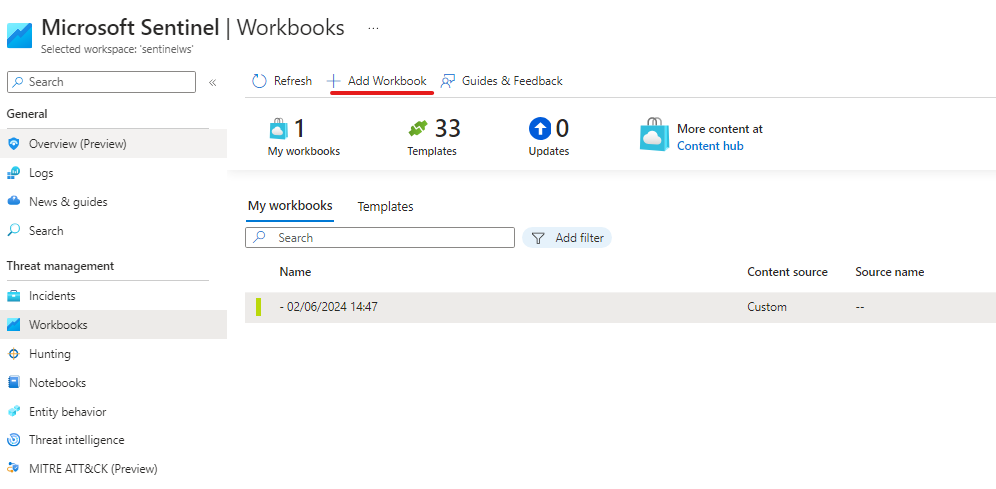
Open Sentinel > and click on Workbooks located under the Threat management tab
Select Add Workbook
Click on edit and use the Add dropdown menu to add items as per your requirements
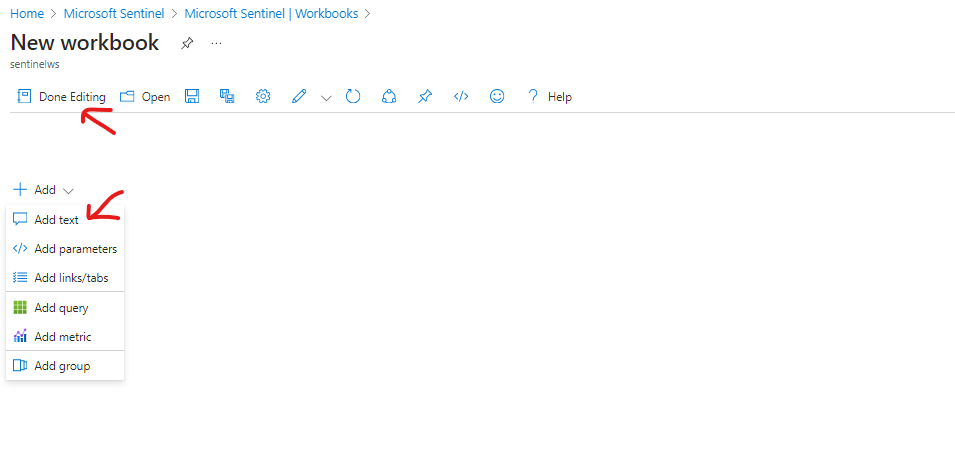
In this case we will use “Add text” to give our dashboard a name which will be SOC Dashboard
>## SOC Dashboard
Select Done editing to save
Now we will select “Add query” from from the Add dropdown menu
Select required parameters for your Workspace (Dashboard)
In my case I will be using the following:Data source: Logs
Resource Type: Log Analytics
Log Analytics workspace: (Select your Sentinel Workspace name)
Time Range: Last 24 hours
Visualization: Time chart
Size: Medium
We will use the following query which will summarize Sign in Logs by count in the last 24 hours
SigninLogs
| summarize count() by bin(TimeGenerated, 1d)
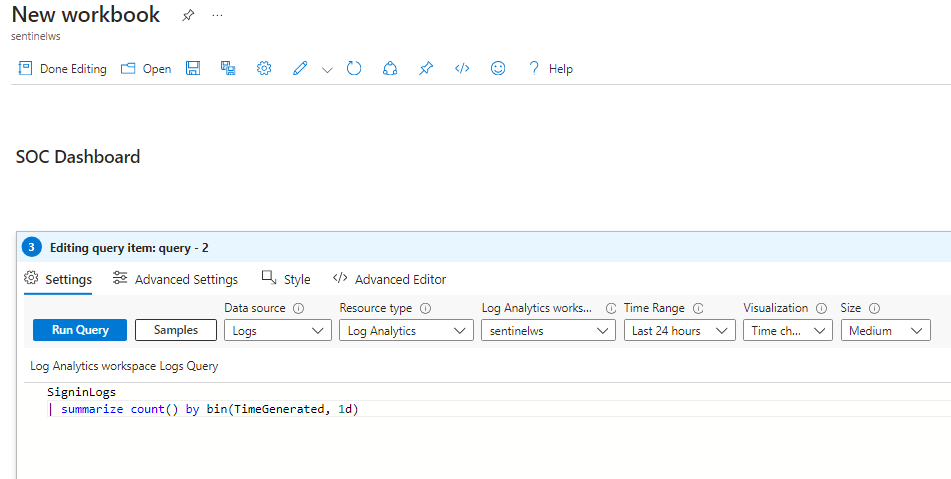
You can test query by clicking on “Run Query” button.
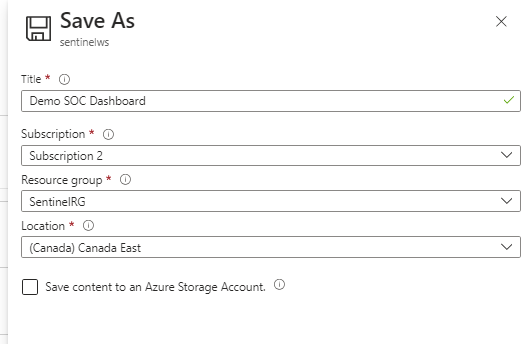
Once completed you can click “Done Editing” > and the “Save” button.
Make sure you pick the correct subscription, resource group, etc.
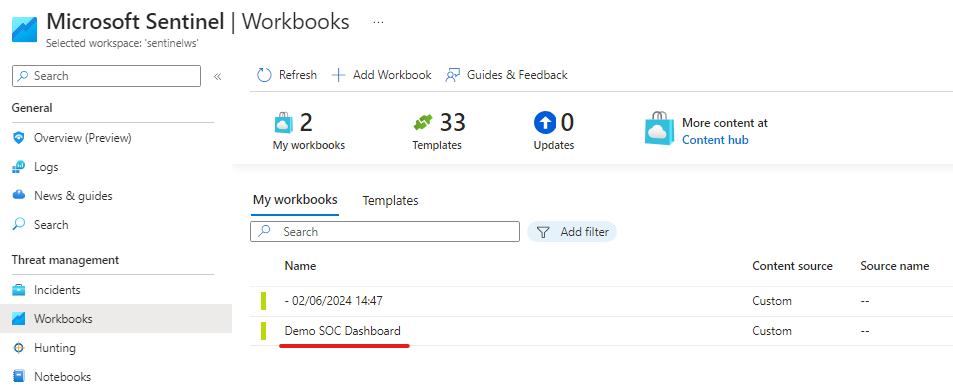
We can no go back to Sentinel Workbooks and verify that we now have added the new workbook we created: